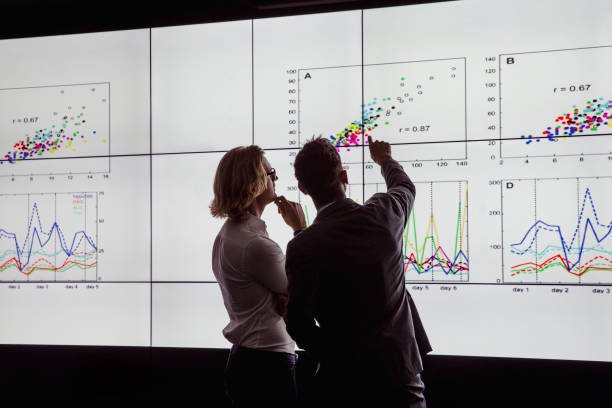
1. Introduction: Harnessing Business Analytics for Market Trends
Business analytics involves using data analysis tools and techniques to enhance decision-making and strategic planning. It entails gathering, analyzing, and interpreting data to identify trends and patterns, which are crucial for informed business strategies. By leveraging analytics, companies gain insights into both past performance and future opportunities, allowing them to stay competitive.
Through the use of both quantitative and qualitative data, business analytics provides a comprehensive view of the market. This enables businesses to better understand customer behavior, assess competitor strategies, and anticipate industry shifts, making it an essential tool for improving overall operations.
2. Data Collection: The Basis for Understanding Market Trends
The foundation of effective market analysis lies in data collection. To comprehend market trends, businesses must first gather relevant and reliable data. With the rise of digital technologies, this process has become more efficient and accurate.

Data can be sourced from surveys, customer feedback, social media, sales transactions, and more. The goal is to collect accurate, up-to-date information that reveals key market trends. High-quality data is essential for producing meaningful insights that can guide decision-making and strategy development.
3. Data Cleaning and Preparation: Ensuring Data Quality
After data collection, the next critical step is data cleaning and preparation. This involves reviewing the raw data to remove duplicates, correct errors, and eliminate irrelevant information. This ensures that the dataset is accurate, consistent, and ready for analysis.
Proper data preparation also involves addressing missing values and formatting the data correctly. Clean and well-organized data forms the backbone of a reliable analysis, allowing businesses to derive accurate insights that lead to informed decision-making.
4. Descriptive Analytics: Analyzing Historical Data
Descriptive analytics focuses on summarizing and interpreting past data to understand “What happened?” It provides insights into historical sales, consumer behavior, and market conditions, helping businesses identify patterns and trends from previous data.
Using charts, graphs, and summary reports, descriptive analytics presents a clear view of past performance. This type of analysis serves as a foundation for more advanced analytics, guiding businesses as they plan future strategies based on historical data.
5. Diagnostic Analytics: Investigating the Causes

Diagnostic analytics delves deeper into data to answer the question, “Why did this happen?” It seeks to uncover the root causes behind certain trends or outcomes by analyzing data at a more detailed level.
Using statistical tools and data mining techniques, diagnostic analytics helps businesses identify the factors driving performance. For example, it can reveal the reasons for a decline in sales or the success of a particular marketing campaign. These insights are invaluable for addressing challenges and making targeted improvements.
6. Predictive Analytics: Forecasting Future Trends
Predictive analytics focuses on anticipating future trends and outcomes by analyzing historical data and using statistical models. It provides businesses with valuable foresight into market conditions, consumer behavior, and potential shifts in the industry.
By utilizing machine learning algorithms and predictive models, companies can estimate the likelihood of specific future events. Predictive analytics allows businesses to develop proactive strategies, positioning them to take advantage of emerging opportunities or mitigate potential risks.
7. Prescriptive Analytics: Recommending Actions
Prescriptive analytics takes predictive insights a step further by providing recommendations on the best course of action. By leveraging optimization techniques and advanced algorithms, prescriptive analytics offers specific strategies that align with business objectives.
This type of analytics is key to strategic decision-making, as it not only predicts what is likely to happen but also suggests how to respond to achieve the best possible outcomes. It empowers businesses to make data-driven decisions that maximize their success.
8. Data Visualization: Simplifying Insights
Data visualization transforms complex data into easy-to-understand visual representations, such as charts, graphs, and dashboards. These visuals make data insights more accessible, facilitating better communication and quicker decision-making.
Tools like Tableau, Power BI, and Excel enable businesses to create interactive and intuitive visualizations. By presenting data in a clear, visual format, companies can quickly identify trends and patterns, allowing them to act on insights more effectively.
9. Tools and Technologies in Business Analytics

Modern business analytics relies on a range of advanced tools and technologies to collect, clean, analyze, and visualize data. Popular tools such as Google Analytics, SAS, IBM SPSS, and R Studio allow businesses to perform comprehensive analyses tailored to their needs.
Each tool offers specific functionalities, enabling businesses to choose the right combination based on their objectives. These tools enhance the accuracy and efficiency of analytics, driving better business decisions and helping companies stay competitive in their respective markets.
10. Conclusion: The Evolving Future of Business Analytics
The future of business analytics is bright, with ongoing advancements in technology continually expanding its capabilities. Data-driven decision-making has become a cornerstone of modern business, and as artificial intelligence and machine learning continue to evolve, analytics will become even more powerful.
Staying current with the latest trends in business analytics is essential for companies that want to remain competitive. By embracing these technologies and methodologies, businesses can gain deeper insights, anticipate market shifts, and position themselves for long-term success.


